L-Town (see Fig. 1) is a small hypothetical town with a population of around 10,000 people. The water utility of L-Town is responsible for delivering drinking water to consumers through a network of pipes with a total length of 42.6km. In previous years, the utility was experiencing a large number of pipe breaks and water losses, affecting its service quality. The water distribution network of L-Town is receiving water from two (2) reservoirs, and the water utility aims at providing water with a pressure head of at least 20m to all of its consumers. A Pressure Reduction Valve (PRV) is installed in the lower part of the town (“Area B”), to help reducing background leakages. PRVs are also installed downstream of the two main reservoirs, to help regulating the pressure. A pump and a water tank have been installed in the higher part of the town (“Area C”), to provide sufficient pressure to the consumers of that area. The tank has a diameter of 16 meters with a cylindrical shape. The pump has been programmed so that the tank should be refilling during the night and emptying to “Area C” during the day. There are three consumer types in L-Town: residential, commercial and industrial. During workdays (Monday to Friday), water consumption follows a similar pattern, whereas during the weekend (Saturday and Sunday), there is higher consumption during late hours as the result of night life. Areas with industrial users do not follow the same pattern of consumption. L-Town is located in the Northern hemisphere, thus higher water usage is expected around July/August, and lower in December/January. For the purposes of this challenge, there are no significant variations of water consumption during holidays or other special days.
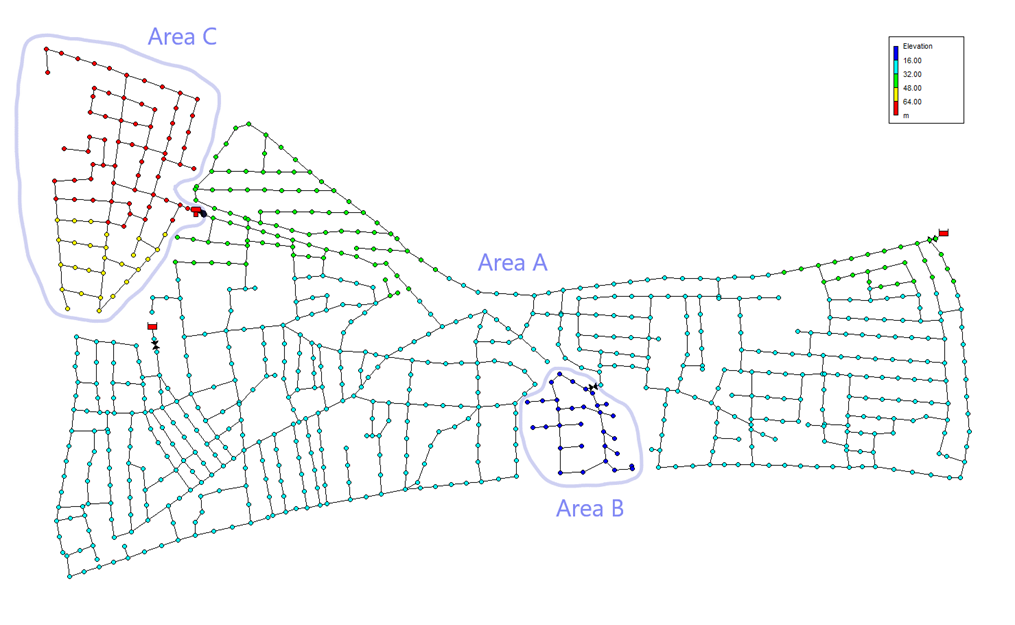
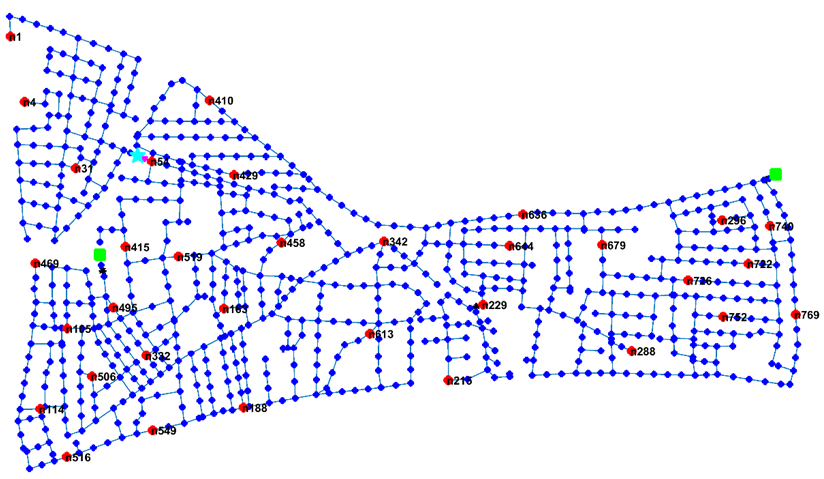
To enhance its capability in monitoring water losses, the water utility of L-Town decided to install one (1) tank water level sensor, three (3) flow sensors, and 33 pressure sensors (see Fig. 2), all transmitting their measurements every 5 minutes to the utility’s Supervisory Control and Data Acquisition (SCADA) System. Pressure sensors give an average value of the last 5 minutes, which mitigates the uncertainty due to pressure transients in the system. In addition, 82 Automated Metered Readings (AMRs) have been installed in “Area C”, for delivering water consumption data directly to the SCADA system (see Fig. 3). Each AMR gives the aggregated consumption of many users in the AMR area.
During 2018, a number of leakage events occurred, which were detected and fixed by the water utility. However, it is believed that a number of smaller leakages occurred but not revealed. It is also assumed that some leakages occurred abruptly, whereas others developed gradually, as incipient events, from background leaks into pipe bursts.
To assist the L-Town water utility decision-making process, the utility developed an EPANET-based nominal model of the distribution network, in which base demands were assigned to nodes, following historical data of proximity consumers. Moreover, two nominal demand patterns were identified for residential and commercial consumer types (with some discrepancies). The utility believes that there might be some inaccuracies in the model, e.g., with respect to the pipe roughness and pipe diameters. In addition, the utility was not able to confirm the status of all the valves in the network (i.e., whether they are open or closed).
The L-Town water utility is searching for a solution to help them analyzing the SCADA dataset, and detect leakage events as fast as possible. In addition, it is crucial for the utility to have an indication where approximately the leakage occurs, so that the field workers can inspect those potential leaks using their equipment.

Competition Goal
The L-Town utility has created an open call for teams to demonstrate their ability in detecting and localizing leakage events. The teams will be given a historical SCADA dataset along with information related with the leakages detected and fixed by the utility throughout 2018, to use for training purposes and for calibrating their models. It is possible that more leakage events occurred during 2018, however the utility was not able to detect and localize them.
Throughout 2019, the utility conducted periodic surveys using additional sensing equipment, pipe inspections and other methods, and was able to detect and isolate all the leakage events that occurred within that period. The most critical of these events were repaired, however it was not possible to repair some of these leakages due to financial reasons.
The overall goal of this competition, is to identify methods which are able to detect and localize the leakage events that occurred in L-Town in 2019, as fast as possible (with respect to time) and as accurately as possible (with respect to their location), in order to minimize their overall financial costs, both in water losses, as well as due to the hours spent in isolating the leakage by the utility staff. The L-Town utility will compare the different solutions and select the best one based on that objective. More details regarding the evaluation procedure will be released in January 2020.